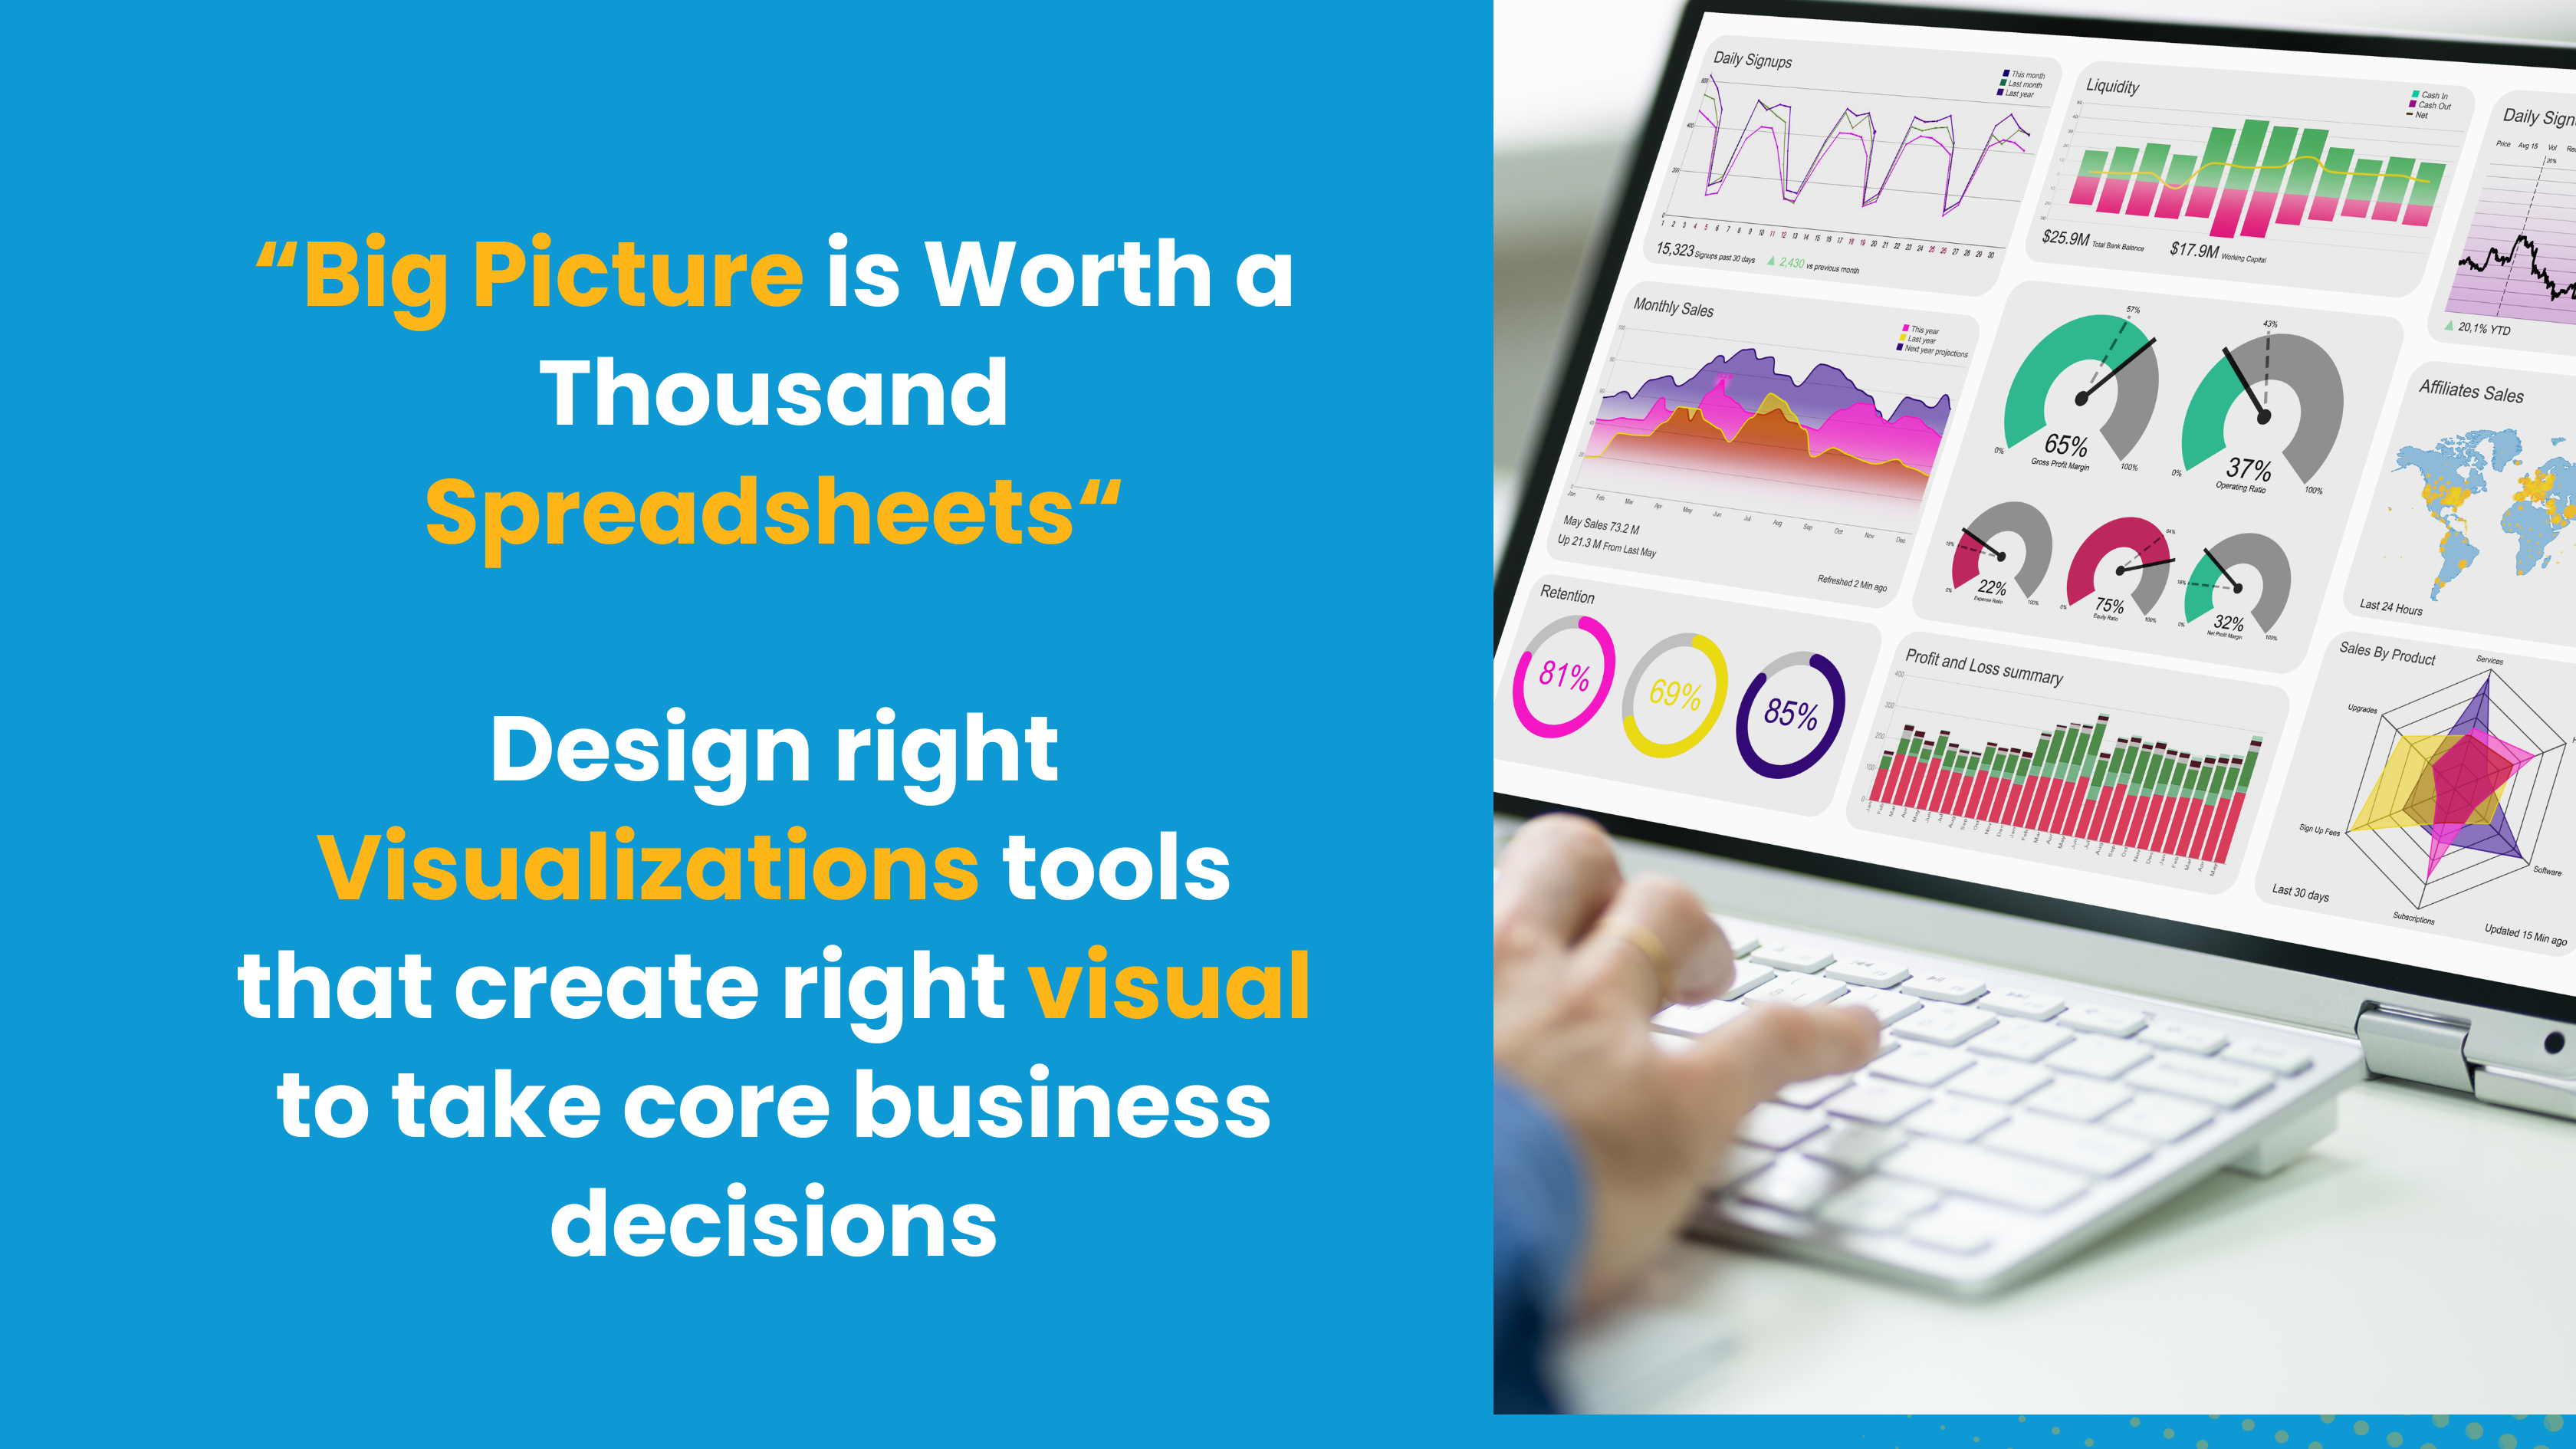
Right chart visualization to take core company's decision
April 22, 2024
Welcome to the Rudolph's blog, where we delve into the latest trends, insights, and innovations shaping the world of financial services. As we stand at the brink of a new era, characterized by rapid technological advancements, evolving consumer preferences, and dynamic market landscapes, the financial services industry is undergoing a profound transformation.
In today's digital age, where information flows freely staying ahead of the curve has been more crucial.
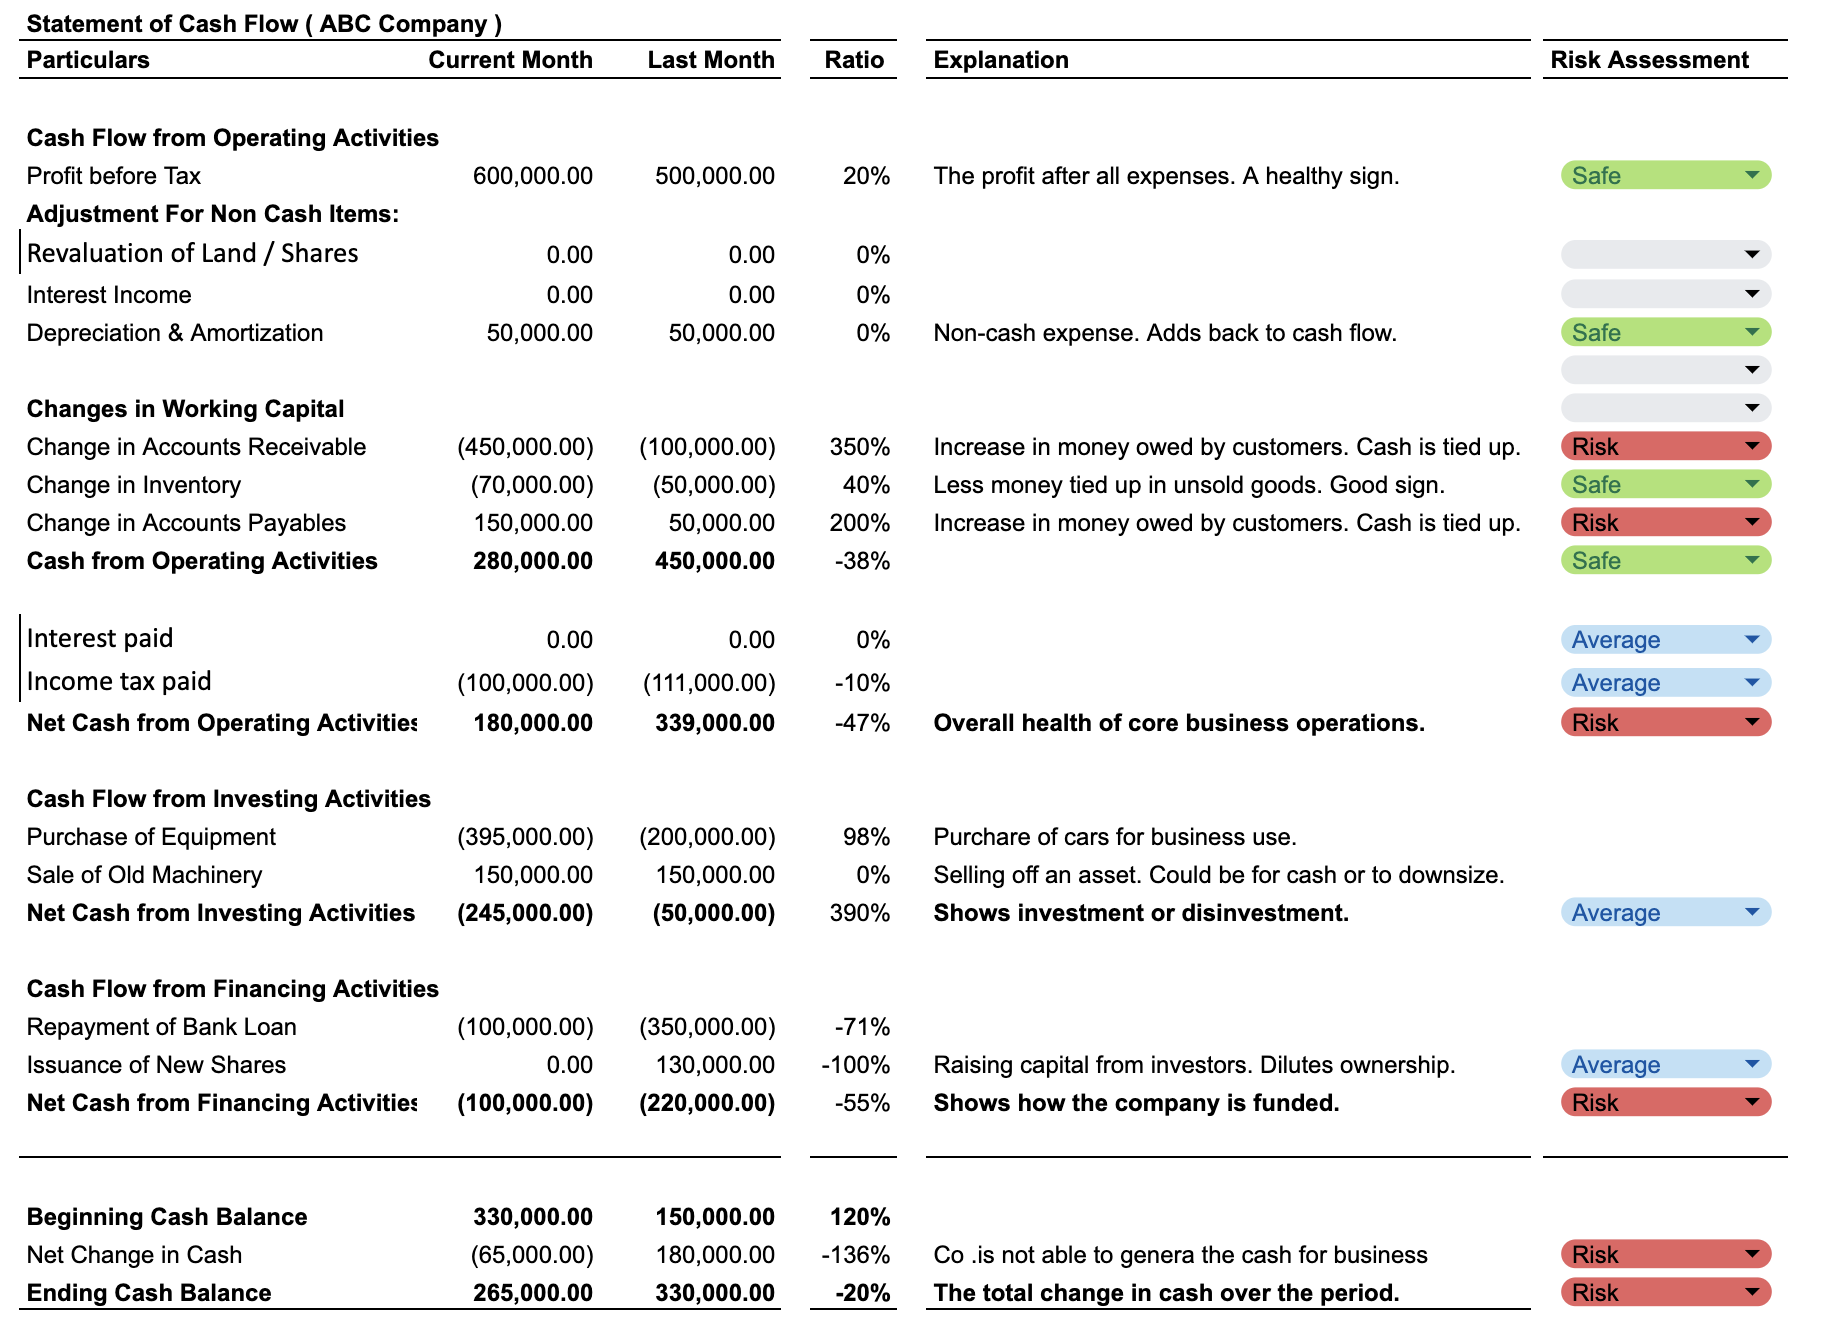
Why key decision markers don't want to go through all the excel data for key decision-making? Why visualization of the right charge is important for decision markers.
Choosing the right visualization is paramount for decision-makers as it directly impacts their ability to derive actionable insights from data. Failure to select an appropriate visualization method can obscure crucial patterns, relationships, and trends within the data, leading decision-makers to misinterpret or overlook valuable information. Without clear and effective visual representations, decision-makers will surely struggle to identify opportunities, mitigate risks, or optimize strategies, ultimately hindering their capacity to make informed decisions that drive organizational success. Thus, the absence of the right visualization not only undermines the accuracy and depth of analysis but also undermines the confidence in decisions made, potentially resulting in missed opportunities or misguided actions.
Let's go through the examples:
Line Charts:
Purpose: Line charts are used to display trends over time or relationships between variables.
Example Decision: A business might use a line chart to track monthly revenue trends and decide whether to adjust pricing strategies or marketing efforts based on fluctuations.
Bar Charts:
Purpose: Bar charts are effective for comparing categories or showing changes over discrete categories.
Example Decision: An organization might use a bar chart to compare sales performance across different regions and allocate resources accordingly.
Pie Charts:
Purpose: Pie charts display parts of a whole and are useful for showing the composition of a data set.
Example Decision: A company might use a pie chart to visualize its expenditure breakdown and identify areas for cost-saving measures.
Scatter Plots:
Purpose: Scatter plots show the relationship between two variables and are helpful for identifying correlations.
Example Decision: An investment firm might use a scatter plot to analyze the relationship between risk and return for different investment portfolios and make decisions on portfolio diversification.
Heatmaps:
Purpose: Heatmaps represent data values with colors, making it easy to identify patterns or outliers.
Example Decision: A retail chain might use a heatmap to analyze store performance across different locations and decide where to open new stores or optimize existing ones.
Histograms:
Purpose: Histograms display the distribution of a single variable and are useful for understanding data distribution.
Example Decision: A manufacturing company might use a histogram to analyze product defect rates and make decisions on quality control processes.
Bubble Charts:
Purpose: Bubble charts display three dimensions of data using the x-axis, y-axis, and bubble size.
Example Decision: A marketing team might use a bubble chart to visualize the effectiveness of advertising campaigns based on metrics such as reach, engagement, and cost, and decide where to allocate ad spend for maximum ROI.
Gantt Charts:
Purpose: Gantt charts are used for project management to visualize project timelines, tasks, and dependencies.
Example Decision: A project manager might use a Gantt chart to track progress on various project tasks and adjust resource allocation or timelines to ensure project deadlines are met.
While visualizations offer many benefits, there are also some potential drawbacks to consider:
- Mis interpretation
- Bias & manipulations
- Cost & Times
- Application resources
- Security & Privacy,
So who are the key people who assist in preparing visualization report in the company
- Financial Analysts
- Financial Controllers
- Finance Managers/Directors
- Chief Financial Officer (CFO)
- Data Analysts/Data Scientists
- Business Intelligence (BI) Specialists
Conclusion
In conclusion, the application of visualization tools in financial analysis has emerged as a powerful strategy for extracting actionable insights from complex datasets. Through the use of visual representations such as charts, graphs, and dashboards, analysts can effectively communicate key trends, patterns, and relationships within financial data, enabling informed decision-making and strategic planning. From identifying business trends to detecting anomalies and mitigating risks, visualization empowers analysts to uncover valuable insights that drive organizational success. As the financial landscape continues to evolve, the integration of visualization techniques will remain essential for unlocking the full potential of data and gaining a competitive edge in the marketplace.
Recommendations as an Analyst and Expert:
- Invest in expertise in visualization tools to effectively analyze and communicate financial information.
- Customize visualizations to suit the needs and preferences of stakeholders, ensuring clear communication of insights.
- Keep visualizations clear and simple, avoiding unnecessary complexity that can obscure key insights.
- Stay updated with best practices, refining skills through practice and learning from industry experts.
- Combine visualizations with narrative storytelling to provide context and highlight key insights.
- Ensure data accuracy and integrity through validation, cleaning, and cross-referencing.
- Encourage collaboration and discussion to promote a deeper understanding of financial data and facilitate informed decision-making.
Author Detail
Manik Balami
Corporate Financial, Legal and Tax Professional
Financial Health Visualization Expert
CFO/ Fractional CFO / Virtual CFO
To reach: manik.balami@rudolphservice.com
Other Blogs